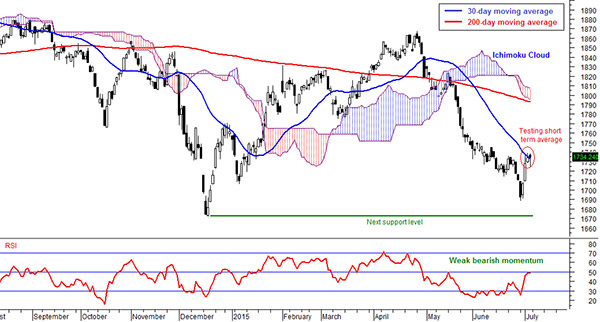
Daily FBM KLCI chart as at July 3, 2015 using Next VIEW Advisor Professional
The market made a u-turn last week after international credit rating agency Fitch maintained Malaysia’s credit rating and upgrade the outlook from negative to stable. Just the week before, Fitch gave a negative outlook rating for the Asia-Pacific region.
In the last article, I mentioned that the market is expected to continue to decline.
The market did declined heavily on Monday but rebounded strongly on Tuesday after Fitch’s rating. So, Fitch has saved the day for Malaysia stock market, but can it last?
The benchmark FBM KLCI increased 1.4 per cent in a week to 1,734.24 points last Friday after rebounding from the low of 1,691.92 points.
Trading volume remained firm with a daily average volume of 1.7 billion shares in the past one week as compared to the previous week.
Average daily trading value in the past one week increased to RM1.9 billion as compared to RM1.8 billion two weeks ago.
In the FBM KLCI, gainers out-paced decliners 18 to 11. Top gainers in the FBM KLCI were British American Tobacco (M) Bhd (7.3 per cent from last week), RHB Capital Bhd (6.8 per cent) and Petronas Chemicals Group Berhad (6.7 per cent).
Top three decliners in the index were Maxis Bhd (1.7 per cent), Tenaga Nasional Bhd (1.4 per cent) and Hong Leong Bank Bhd (1.3 per cent).
From Monday to Thursday last week, foreign institutions and local retail were net sellers at RM250.9 million and RM151.8 million respectively. Net buying local institutions was RM402.7 million.
Regional indices
Markets in Asia were generally bearish. China market continued to take a beating on stock market manipulation probe.
China’s Shanghai Stock Exchange Composite Index plunged 12 per cent in a week to 3,684.36 points.
The index has fallen 29 per cent in two weeks. Hong Kong’s Hang Seng Index declined 2.2 per cent in a week to 26,064.11 points. However, Japan Nikkei 225 fell 0.8 per cent to 20,539.79 points and Singapore’s Straits Times Index increased 0.7 per cent to 3,342.73 points.
Markets in US and Europe fell on Greece’s crisis. On Thursday, the US Dow Jones Industrial Average declined 0.9 per cent in week to 17,730.11 points. Germany’s DAX Index declined 3.3 per cent to 11,095.35 points.
London’s FTSE100 fell 2.7 per cent in a week to 6,631.45 points.
Commodities
The US dollar index increased from 95.4 points a week ago to 96.3 points.
The Malaysian ringgit weakened against the US dollar at RM3.77 per US dollar, the lowest in 10 years. Strong US dollar continued to pressure gold price, which fell 0.6 per cent in a week to US$1,165.2 an ounce.
WTI crude oil declined 4.6 per cent in a week to US$56.87 per barrel.
Crude palm oil in Bursa Malaysia rose 1.3 per cent in a week to RM2,269 per metric tonne on higher demand prospect.
Observations
The FBM KLCI broke its six weeks of declines last week. The market rebounded and is currently testing the short term 30-day moving average.
This indicates that the price trend is still bearish.
The long term 200-day moving average is currently at 1,793 points. Furthermore, the index is still under the thick Ichimoku Cloud indicator.
The momentum indicators increased last week but still bearish.
The RSI increased but remained below its mid-level. The MACD is increasing but below the zero line and the index went above the middle band but not the top band.
All these indicators indicate that the bearish trend is weak instead turning bullish.
The indicators show that the index is currently in a technical rebound of a down trend and not a bullish reversal.
The index needs to break above the immediate resistance levels at 1,745 and 1,760 points to boost market confidence and turn bullish.
If it fails to break above this level in the short term, we may see a continuation of the down trend.
For this week, I am expecting the market to be directionless and the index to trade between 1,715 and 1,745 points.
The above commentary is solely used for educational purposes and is the contributor’s point of view using technical al analysis. The commentary should not be construed as an investment advice or any form of recommendation. Should you need investment advice, please consult a licensed investment advisor.