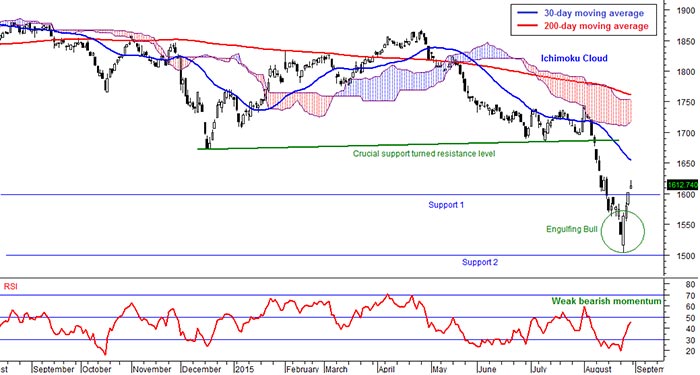
Daily FBM KLCI chart as at August 28, 2015 using Next VIEW Advisor Professional
The market started on a bearish note last week but strongly rebounded to close higher. The market was supported by bargain hunting on energy stocks and strong ringgit and rebounds in regional markets also helped boost market confidence. FBM KLCI increased 2.4 per cent in a week to 1,612.74 points last Friday. The ringgit strengthened from RM4.22 to a US dollar a week ago to RM4.16.
Buying came in to support the selling pressure last week and this increased the market trading volume.
The average trading volume last week increased from two billion shares last week to 2.4 billion shares. The average trading value in the past one week increased to RM2.4 billion as compared to RM2.1 billion.
The support on energy stocks came in from local institutions as foreign institutions extended their selling.
From Monday to Thursday last week, net selling from foreign institutions was RM1.09 billion and net buying from local institutions was RM1.03 million.
Gainers trounced decliners five to one in the FBM KLCI from last week. Top gainers in the FBM KLCI were Petronas Chemicals Group Bhd (8.8 per cent from last week), Tenaga Nasional Bhd (6.7 per cent) and Sapurakencana Petroleum Bhd (5.5 per cent).
Top decliners were Genting Bhd (2.7 per cent), Sime Darby Bhd (2.1 per cent) and UMW Holdings Bhd (1.9 per cent).
Markets rebounded in the second half of last week to recover losses made earlier but still closed lower on a week-to-week basis. China’s Shanghai Stock Exchange Composite Index fell 7.8 per cent in a week to 3,234.61 points.
Hong Kong’s Hang Seng Index declined 3.6 per cent to 21,612.39 points. Japan Nikkei 225 index declined 1.5 per cent in a week to 19,136.32 points and Singapore’s Straits Times shed only 0.7 per cent to 2,955.94 points.
Western markets performances followed cues from Asian markets. On Thursday, the US Dow Jones Industrial Average declined two per cent in a week to 16,654.77 points. Germany’s DAX Index fell 1.1 per cent to 10,315.62 points in a week and London’s FTSE100 declined 2.6 per cent to 6,200.87 points.
The US dollar index declined in the earlier part of last week but rebounded to close marginally lower.
The US dollar index declined from 96 points a week ago to 95.7 points last Thursday. Rebound in equity markets caused gold to pull back for a correction. COMEX gold fell 2.5 per cent in a week to US$1,123.40 an ounce. WTI crude oil rebounded and increased 4.3 per cent in a week to US$42.78 per barrel.
Crude palm oil in Bursa Malaysia declined 0.4 per cent in a week to RM1,994 per metric tonne after rebounding from a low of RM1,863.
The FBM KLCI rose above the support level at 1,600 points that was broken just a week ago. We mentioned that the next technical support level is at 1,540 points.
The FBM KLCI went as low as 1,503.68 points last week but immediately rebounded. This indicates support.
However, the trend remained technically bearish as the FBM KLCI is below the short term 30-day moving average.
The FBM KLCI is also below the Ichimoku Cloud indicator.
The cloud is beginning to become narrow and this indicates that the market is about to move into a correction, as I have mentioned two weeks ago on the Ichimoku indicator.
Momentum indicators like the RSI and Momentum Oscillator are beginning to increase. However, these indicators are still below their mid-levels and this indicates a weak bearish momentum.
Furthermore, the FBM KLCI is below the middle band of the Bollinger Bands indicator.
The question now would be whether the FBM KLCI is able to turn into a rally after the strong rebound last week.
A breakout above the 1,600 points level indicates a good support. However, the FBM KLCI is not out of the bearish trend yet as it is still below the averages.
The FBM KLCI may continue to climb higher and test the short term 30-day moving average at 1,650 if it can stay above 1,600 points.
Failure to stay above 1,600 points could cause the market to fall further into correction.
The above commentary is solely used for educational purposes and is the contributor’s point of view using technical analysis. The commentary should not be construed as an investment advice or any form of recommendation. Should you need investment advice, please consult a licensed investment advisor.