 Malaysian palm oil futures edged lower on Friday to 2,689, due to sluggish export demand and a correction in rival soyoil prices prompted traders to book profits.
Future Crude Palm Oil (FCPO) benchmark July 2016 contract settled at 2,689 on Friday, up 45 points or 1.7 per cent from 2,644 last Friday.
Trading volume increased to 202,998 contracts from 178,871 contracts from last Monday to Thursday.
Open interest based increased to 1.054 million contracts from 1.034 million contracts from last Monday to Thursday.
Intertek Testing Services (ITS) reported that exports of Malaysia’s palm oil products during April 1 to 20 increased 3.5 per cent to 737,685 tonnes compared with 712,954 tonnes during March 1 to 20.
Societe Generale de Surveillance’s (SGS) report showed that Malaysia’s palm oil exports during April 1 to 20 increased 0.9 per cent to 724,169 tonnes compared with 717,670 tonnes during March 1 to 20.
Overall, demand strengthened from Pakistan, while demand weakened from the European Union, the US, China, and India.
Spot ringgit weakened on Friday to 3.8960, as the US dollar strengthened after the European Central Bank chief reasserted his readiness to provide further stimulus for the eurozone economy if necessary, and ahead of US Federal Reserve’s two-day policy meeting on April 26 and 27.
On Monday, the price rose, after two consecutive weeks of losses, as a weaker ringgit and improving exports supported the market.
On Tuesday and Wednesday, the price climbed, touching the highest in nearly two weeks, due to tracking a rally in alternative vegetable oils, after suffering losses in the previous two weeks.
On Thursday, the price rose for the fourth consecutive day, touching the highest in more than two weeks, while remaining range-bound, on expectations of lower production following hot and dry weather brought by El Nino weather pattern.
On Friday, the price fell for the first time in five days, as sluggish export demand and a correction in rival soyoil prices prompted traders to book profits.
Technical analysis
According to the weekly FCPO chart, the price opened above the middle Bollinger band and psychological barrier at 2,600. By the end of the week, the price tested the psychological barrier at 2,700, closing below.
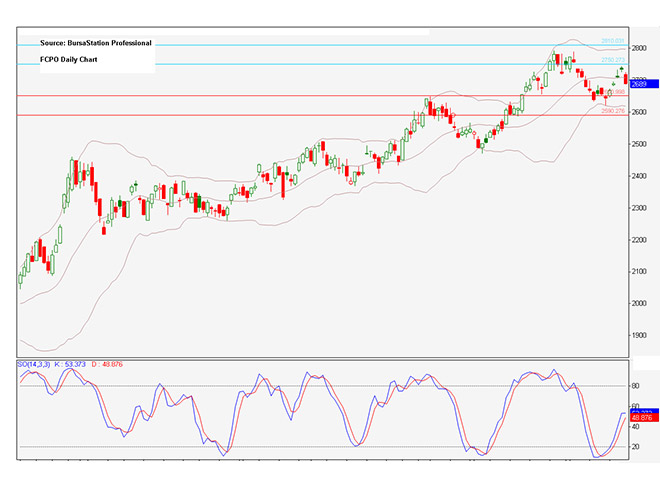
According to the daily FCPO chart, on Monday, the price opened above the bottom Bollinger band and psychological barrier at 2,600, while the SO remained in oversold territory.
An upside gap was formed from 2,645 to 2,655, which if able to be covered, could indicate potential to test the psychological barrier at 2,600 in the near term.
By the later session, the previous gap was covered, while the price closed above the bottom Bollinger band and psychological barrier at 2,600.
On Tuesday, the price opened below the middle Bollinger band and resistance level at 2,690.
An upside gap was formed from 2,670 to 2,685, which if able to be covered, could indicate potential to close below the resistance level at 2,690.
By the later session, the previous gap was unable to be covered, and the price tested the resistance level at 2,690, closing below, while the SO exited oversold territory.
On Wednesday, the price opened above the middle Bollinger band and psychological barrier at 2,700.
An upside gap was formed from 2,680 to 2,710, which if able to be covered, could indicate the potential to close below the resistance level at 2,690.
By the later session, the previous gap was unable to be covered, while the price tested the middle Bollinger band, closing above.
On Thursday, the price opened above the middle Bollinger band and psychological barrier at 2,700.
An upside gap was formed from 2,710 to 2,740, which if able to be covered, could indicate potential to test the middle Bollinger band and psychological barrier at 2,700.
By the later session, the previous gap was unable to covered, while the price closed above the middle Bollinger band and psychological barrier at 2,700.
The price attempted to the cover the previous downside gap from 2,735 to 2,755 formed on April 6, which if able to be covered, could indicate potential to test the top Bollinger band and psychological barrier at 2,800 in the near term.
On Friday, the price opened above the middle Bollinger band and below resistance level at 2,750. A downside gap was formed from 2,720 to 2,735, which if able to be covered, could indicate potential to test the resistance level at 2,750.
By the later session, the previous gap was unable to be covered, while the price tested the middle Bollinger band and psychological barrier at 2,700, closing below.
The price covered the previous upside gap from 2,690 to 2,715, formed on April 20, which could indicate potential to test the support level at 2,650 in the near term.
In the coming week, the price has potential to range between 2,650 and 2,800.
Resistance lines will be placed at 2,750 and 2,810, while support lines will be positioned at 2,650 and 2,590, these levels will be observed this coming week.
Major fundamental news this coming week
ITS and SGS report released on the April 25 (Monday).
Oriental Pacific Futures (OPF) is a Trading Participant and Clearing Participant of Bursa Malaysia Derivatives. You may reach us at www.opf.com.my. Disclaimer: This article is written for general information only. The writers, publishers and OPF will not be held liable for any damage or trading losses that result from the use of this article.