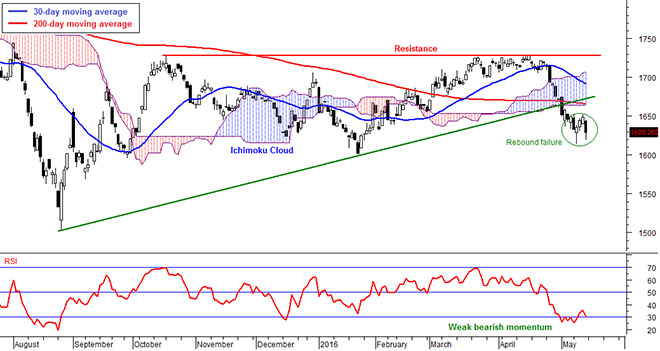
Daily FBM KLCI chart as at May 13, 2016 using
Next VIEW Advisor Professional
We expected the market to stage a technical rebound last week and we did see some rebound on Tuesday and the market rose for three days.
However, the market declined steeply last Friday and led to a fourth weekly decline. Equity markets globally remained uncertain and investors opt for safer investment instruments like bonds. Weaker ringgit has also weakened market sentiment and foreign institutions continued to sell.
The FBM KLCI declined 1.3 per cent in a week to 1,628.26 points on relatively higher trading volume. This indicates slightly stronger selling pressure.
The average daily trading volume in the past one week rose from 1.6 billion shares to weeks ago to 1.8 billion. The average trading value increased from RM1.9 billion to RM2.1 billion.
Foreign institutions continued to exit the market as ringgit weakens.
Net selling from foreign institutions last week was RM1,004 million and net buying from local institution and local retail were RM904 million and RM100 million respectively. The Malaysian ringgit weakened from RM4.40 to a US dollar to RM6.03 in a week.
In the FBM KLCI, decliners out-paced gainers 17 to 11. The top gainers for the week were Astro (M) Holdings Bhd (4.5 per cent in a week to RM2.80), British American Tobacco (M) Bhd (4.2 per cent to RM48.98) and YTL Corporation Bhd (1.9 per cent to RM1.60).
The top decliners were MISC Bhd (10.8 per cent to RM7.44), CIMB Group Holdings Bhd (5.6 per cent to RM4.40) and UMW Holdings Bhd (4.4 per cent to RM6.03).
Markets performances in Asia were mixed. China’s Shanghai Stock Exchange Composite index fell 2.9 per cent in a week to 2,827.37 points last Friday. Hong Kong’s Hang Seng Index declined 1.9 per cent in a week to 19,719.29 points and Singapore’s Straits Times closed marginally higher at 2,734.91 points.
The Nikkei 225 index increased 1.9 per cent in a week to 16,412.21 points.
The US and European markets were also mixed. The US Dow Jones Industrial Average increased only 0.3 per cent in a week to 17,720.5 points last Thursday.
Germany’s DAX Index increased 0.1 per cent in a week to 9,862.12 points and London’s FTSE100 declined 0.2 per cent to 6,104.19 points Thursday.
The US dollar continued to strengthen against major currencies. The US dollar index futures increased from 93.8 points last week to 94.1 points.
Crude oil pulled back for a correction after hitting a 6-month high two weeks ago. US Crude oil (WTI) increased 4.3 per cent in a week to US$46.39 per barrel, the highest in six months. COMEX Gold declined 1.2 per cent in a week to US$1,264.70 an ounce. Crude palm oil in Bursa Malaysia declined 1.7 per cent in a week to RM2,586 per metric tonne on higher than expected palm oil output in April.
The FBM KLCI failed to rebound as expected despite indicators showing that the index is oversold.
The index remained bearish below the short and long term 30 and 200 day moving averages. Furthermore, the index is below the Ichimoku Cloud indicator. The cloud is wide until two weeks and this indicates that the market may continue to face resistance.
Momentum indicators increased last week and this indicators weaker bearish momentum. However, indicators like RSI and Momentum Oscillator are still below their middle levels and this indicates that the bears are still in control. Furthermore, the index is trading near the bottom band of the Bollinger bands indicator and the MACD indicator below its moving average.
The market may be oversold as technically indicate but sentiment remain bearish. The market rebounded but was very weak and this indicates the selling in May is not over. Markets globally continued to be uncertain and this weakened confidence further. Weakening ringgit added salt to the wound.
After a weak performance last week, we expect the market to continue its bearish trend. Immediate support level is at 1,614 points but this is expected to be broken and the index to fall to the next support level at 1,600 points.
The above commentary is solely used for educational purposes and is the contributor’s point of view using technical al analysis. The commentary should not be construed as an investment advice or any form of recommendation.
Should you need investment advice, please consult a licensed investment advisor.