Daily FBM KLCI chart as at May 20, 2016 using
Next VIEW Advisor Professional
The market seems to be directionless in the past one week and I mentioned that the bears are still in control. However, there is still some support as the FBM KLCI was held firm from last week.
Foreign institutions continued to sell on weak ringgit. The FBM KLCI closed almost unchanged at 1,628.79 points after trading in a range between 1,611.91 and 1,637.37 points.
The average daily trading volume in the past one was firm at 1.8 billion shares as compared to its previous week.
The average trading value declined from RM2.1 billion to RM1.9 billion, an indication of more lower-capped stocks being traded.
Foreign institutions continued to exit the market as ringgit weakens. Net selling from foreign institutions last week was RM1.16 billion and net buying from local institutions was RM1.18 million.
Local retail was net seller at RM0.02 billion. The Malaysian ringgit weakened from RM4.03 to a US dollar to RM4.07 in a week.
In the FBM KLCI, decliners marginally led gainers eight to seven.
The top gainers for the week were Petronas Chemicals Group Bhd (3.2 per cent in a week to RM6.40), Petronas Dagangan Bhd (3.1 per cent to RM23.40) and Sapurakencana Petroleum Bhd (2.5 per cent to RM1.62).
The top decliners were UMW Holdings Bhd (5.5 per cent to RM5.70), Axiata Group Bhd (2.2 per cent to RM5.41) and Astro Malaysia Holdings Bhd (2.1 per cent to RM2.74).
Markets were slightly bullish led by Japan. China’s Shanghai Stock Exchange Composite declined marginally to 2,825.94 points last Friday. Hong Kong’s Hang Seng Index rose 0.7 per cent in a week to 19,852.19 points and Singapore’s Straits Times increased 0.1 per cent to 2,763.82 points. The Nikkei 225 index increased two per cent in a week to 16,736.35 points 16,412.21 points.
The US and European markets were mixed. The US Dow Jones Industrial Average declined 0.2 per cent in a week to 17,500.94 points last Friday.
Germany’s DAX Index fell 0.4 per cent in a week to 9,916.02 points and London’s FTSE100 rose 0.3 per cent to 6,156.32 points.
The US dollar index futures increased from 94.6 points last week to 95.3 points. Crude oil continued to climb to fresh six-month highs. US Crude oil (WTI) increased 4.5 per cent in a week to US$48.48 per barrel.
However, COMEX Gold declined 1.7 per cent in a week to US$1,252.90 an ounce.
Crude palm oil in Bursa Malaysia fell 2.3 per cent in a week to RM2,527 per metric tonne.
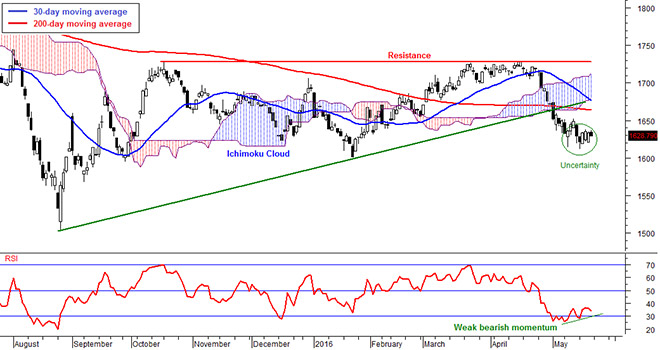
Technically, the FBM KLCI remained bearish below both the short and long term 30 and 200 day moving averages.
The index is also below the Ichimoku Cloud indicator and the widening cloud indicates that there is still strong resistance. The Cloud only shrinks in two weeks time and based on this indicator, this is when the resistance turns weak.
Momentum indicators are still bearish but are beginning to show a bullish divergence.
For the past two weeks, the RSI has found support and started to slightly increase. The MACD indicator is about to cross above its moving average.
The Bollinger Bands continued to contract but the FBM KLCI is now moving towards its mid-band, and indication of a weak bearish trend.
There is still no reversal despite the FBM KLCI showing that the market is technically oversold.
There was support in the past two weeks despite selling pressure but was weak as the market lacked confidence.
Chart-wise, there were no clear reversal indications.
After four weeks of declines, the FBM KLCI finally held firm and on the weekly chart, it formed a “doji” Japanese candlesticks chart pattern.
This indicates uncertainty. Therefore, there are still no signs of reversal and the only indication we can get is that the bearish trend is weak.
However, the candlesticks pattern can turn into a “Morning Star” chart pattern if the FBM KLCI close higher this week. This pattern is a bullish reversal pattern.
However, the FBM KLCI may fall to 1,600 points if the index fails to climb higher this week as the trend is still bearish.
The above commentary is solely used for educational purposes and is the contributor’s point of view using technical al analysis. The commentary should not be construed as an investment advice or any form of recommendation.
Should you need investment advice, please consult a licensed investment advisor.