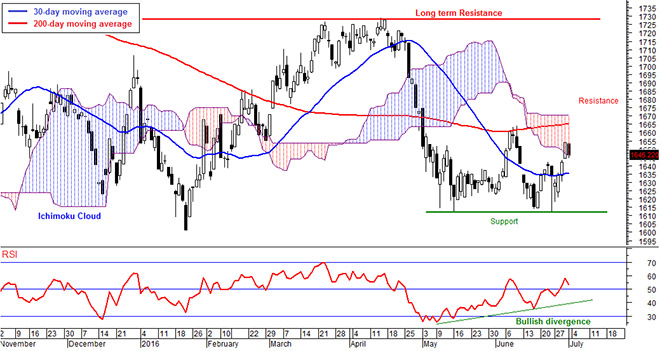
Daily FBM KLCI chart as at July 1, 2016 using Next VIEW Advisor Professional
We are now in the second half of the year and the performance so far has been firm with a roller coaster ride in between. The market was bullish in the first quarter but the bearish second quarter erased gains made in the first quarter and therefore we are back to where the market was in the beginning of the year.
The market was bullish last week as investors looked for bargains as global markets rebounded and ringgit strengthened. The Brexit saga eased but the market remained cautious as trading volume remained low. The benchmark FBM KLCI increased only 0.7 per cent in a week to 1,646.22 points.
The average daily trading volume last week was 1.4 billion shares as compared to 1.6 billion shares two weeks ago. The market is also being cautious ahead of a short trading week this week because of Hari Raya holidays. The average daily trading volume declined from RM1.8 billion to RM1.7 billion. This shows that the market is still traded mostly by institutions.
Local institutions were the support for the bullish trend last week but we are also seeing foreign buying coming in towards the end of the week. Net buy from local institutions in the past one week was RM52 million. Net sell from foreign institutions was only RM1 million and therefore, local retail was the biggest net seller at RM51 million. The ringgit strengthened against the US dollar from RM4.07 to a US dollar a week ago to RM4.
In the FBM KLCI, gainers out-paced decliners 3 to 1. The top gainers for the week were Hong Leong Financial Group Bhd (7.3 per cent in a week to RM15), Sapurakencana Petroleum Bhd (5.9 per cent to RM1.43) and Astro Malaysia Holdings Bhd (3.2 per cent to RM2.87). The top decliners were RHB Capital Bhd (15.9 per cent to RM5.13), Westports Holdings Bhd (1.6 per cent to RM4.20) and IHH Healthcare Bhd (1.3 per cent to RM6.61).
Markets rebounded strongly in Asia after weeks of declines. China’s Shanghai Stock Exchange Composite increased 2.8 per cent in a week to 2,932.82 points last Friday. Hong Kong’s Hang Seng Index rose 2.6 per cent to 20,794.37 points last Thursday. The market was closed last Friday for holiday. Singapore’s Straits Times rose 4.1 per cent in week to 2,846.37 points and Japan’s Nikkei 225 index increased 4.9 per cent to 15,684.36 points.
Markets in US and europe rebounded last week but were mostly lower on a week to week basis because of the massive sell down the day after Britain decided to leave europe. The US Dow Jones Industrial Average declined 0.4 per cent in a week to 17,929.99 points last Thursday. Germany’s DAX Index fell 5.6 per cent in a week to 9,680.09 points. However, London’s FTSE100 increased 2.6 per cent to 6,504.33 points despite the UK exiting the european Union. It seemed that market confidence is better for Britain without europe.
US dollar gained strength against major currencies, particularly euro and British pound. The US dollar index futures rose from 93.5 points to 96.2 points last Thursday. Gold jumped last Friday as currencies turned volatile. COMEX Gold jumped 5.2 per cent in week to US$1,324.70 an ounce. Crude palm oil in Bursa Malaysia fell for the fourth week, declining one per cent in a week to RM2,358 per metric tonne on demand worries and stronger ringgit.
The FBM KLCI looks like being strongly supported above 1,610 points and the bullish strength seem to be stronger than bearish pressure as there are more bullish than bearish daily candlesticks. Furthermore, the index climbed above the short term 30-day moving average and this average is increasing. Even the long term 200-day moving average is increasing. Technically, the trend is turning bullish.
The FBM KLCI needs to climb above its long term 200-day moving average at 1,665 points to build more confidence. The top band of the Ichimoku Cloud is at 1,670 points. Therefore, the immediate resistance level is between 1,665 and 1,670 points. The momentum indicators show that there is a high chance for the FBM KLCI to test this level in the short term.
The index is expected to test the above said immediate resistance in the short term but breaking above this level would need stronger confidence. Technically, the chart indicates that the market is still oversold and a rebound is expected as bargain hunters will start to look for opportunities in the beginning of the second half of the year. A breakout above 1,670 points could bring the index to test the highest levels this year at 1,720 points.
The above commentary is solely used for educational purposes and is the contributor’s point of view using technical analysis. The commentary should not be construed as an investment advice or any form of recommendation. Should you need investment advice, please consult a licensed investment advisor.