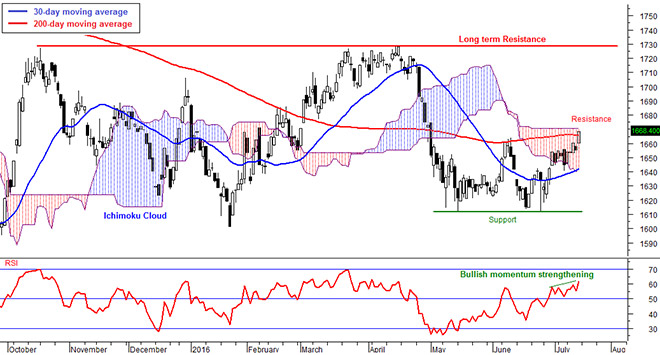
Daily FBM KLCI chart as at July 15, 2016 using Next VIEW Advisor Professional
The market was bullish last week on a set of a few catalysts. Firstly, Bank Negara has reduced the overnight policy rate (OPR) a quarter basis point to three per cent. Secondly, the ringgit has strengthened against the US dollar and lastly, the bullish performances in the global equity markets helped built market confidence.
The FBM KLCI is currently facing the resistance level that I have mentioned last week which is between 1,665 and 1,670 points. The index rose 1.5 per cent in a week to 1,668.40 points, the highest in nearly three months. Therefore, the market is at a crucial level. It is either going to break above this resistance and rally or reverse pull back. Let’s see what the indications the market is providing.
Trading volume has started to increase as market participants returned from holidays and bargain hunt. The average daily trading volume last week was only 1.7 billion shares as compared to only 1.0 billion shares two weeks ago. The average daily trading value increased from RM1.2 billion to RM2.0 billion.
Foreign institutions continued to bargain hunt last week after seeing a turnaround two weeks ago on stronger ringgit. Net buy from foreign institutions was RM764 million while net sell from local retail was RM240 million. Net sell from local institutions was RM524 million. The ringgit was strengthened against the US dollar from RM4 per dollar to RM3.92.
In the FBM KLCI, gainers pounced decliners five to one. The top gainers for the week were Genting Bhd (9.9 per cent in a week to RM8.76), UMW Holdings Bhd (6.9 per cent to RM5.75) and IOI Properties Group Bhd (5.2 per cent to RM2.45). The top decliners were CIMB Group Holdings Bhd (three per cent to RM4.26), Hong Leong Financial Group Bhd (1.1 per cent to RM15.14) and British American Tobacco (M) Bhd (0.5 per cent to RM54.16).
Markets performances in Asia were generally bullish. China’s Shanghai Stock Exchange Composite increased 2.2 per cent in a week to 3,053.68 points last Friday. Hong Kong’s Hang Seng Index rose to its highest in six months, climbing 5.3 per cent in a week to 21,659.25 points. Singapore’s Straits Times rose 2.8 per cent to 2,925.35 points. Japan’s Nikkei 225 index jumped 9.2 per cent in a week to 16,497.85 points.
The US market, benchmarked by the Dow Jones Industrial Average (DJIA), rose to a record high and Europe continued its bullish trend. The US Dow Jones Industrial Average increased two per cent in a week to 18,516.55 points on Friday. London’s FTSE100 increased 1.2 per cent to 6,669.24 points and Germany’s DAX Index rose 5.4 per cent to 10,066.90 points.
US dollar marginally strengthened against major currencies. The US dollar index futures rose from 96.3 points to 96.6 points last Friday. Gold lost its shine as investors flocking back to equity markets after climbing to a 28-month high. COMEX Gold fell 2.2 per cent in week to US$1,337.70 an ounce. Crude oil (Brent) rebounded and increased 1.7 per cent in a week to US$47.60 per barrel. Crude palm oil in Bursa Malaysia rebounded and rose 1.1 per cent in a week to RM2,279 per metric tonne after five weeks of declines.
The FBM KLCI is currently at the resistance level. The index has climbed above the long term 200-day moving average and to its highest level in nearly three months and this indicates a good bullish momentum. Furthermore, the index is currently in the Ichimoku Cloud, with resistance at 1,670 points.
Momentum indicators are beginning to show strength in its bullish rally. The RSI and MACD indicators are making new short term highs and the index climbed above the top band of the Bollinger Bands indicator. It also broke above the neck line of a double bottom chart pattern at 1,664 points and this confirmed the bullish reversal pattern.
Investors are increasing their risk appetite as they started to bargain hunt in the second half of the year as I have mentioned last week. Sentiment is still bullish as global markets continued to rise. Technical indicators are indicating a strong build up in momentum.
Henceforth, the FBM KLCI is expected to rally in the short term and is likely going to test the 1,720 points resistance level, which is also the target for the double bottom chart pattern. The market to remain bullish if the FBM KLCI can stay above the short term 30-day moving average currently at 1,640 points.
The above commentary is solely used for educational purposes and is the contributor’s point of view using technical analysis. The commentary should not be construed as an investment advice or any form of recommendation. Should you need investment advice, please consult a licensed investment advisor.