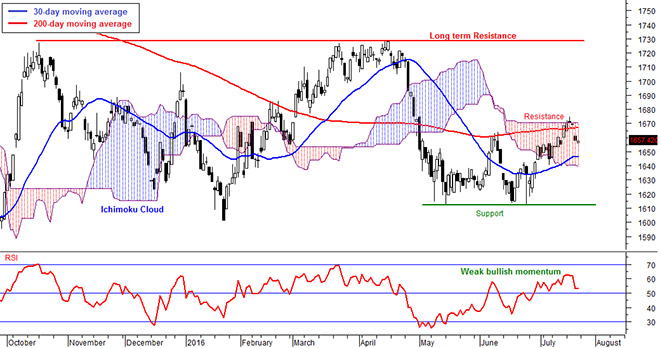
Daily FBM KLCI chart as at July 22, 2016 using Next VIEW Advisor Professional
The market was expected to be bullish last week. It started on a bullish mode but fell as market sentiment was bruised by the alleged 1MDB scandal in the US. The ringgit weakened as well and this triggered selling by foreign institutions that have started buying in the past two weeks. The FBM KLCI declined 0.7 per cent in a week to 1,657.42 points.
Trading volume continued to increase last week especially in the early part of the week when the market was still bargain hunting.
The average daily trading volume last week was 1.9 billion shares as compared to 1.7 billion shares two weeks ago. However, the average daily trading value fell from RM2 billion to RM1.8 billion and this indicates more lower-capped stocks are being traded. Lower capped stocks are normally being trade by the retail market.
Foreign institutions remained net buyers in Bursa Malaysia last week despite the selling in the later part of the week.
Net buy from foreign institutions was only RM32 million while net sell from local retail was RM31 million. The ringgit weakened against the US dollar from RM3.92 per dollar to RM4.07.
Decliners outpaced decliners two to one in the FBM KLCI. The top gainers for the week were Hong Leong Financial Group Bhd (1.7 per cent in a week to RM15.40), Genting Bhd (1.5 per cent to RM8.89) and Westports Holdings Bhd (0.9 per cent to RM4.33).
The top decliners were PPB Group Bhd (four per cent to RM15.84), Sapurakencana Petroleum Bhd (3.4 per cent to RM1.41) and AMMB Holdings Bhd (2.7 per cent to RM4.27).
Markets performances in Asia were generally bullish except for China. China’s Shanghai Stock Exchange Composite declined one per cent in a week to 3,012.43 points last Friday. Hong Kong’s Hang Seng Index increased 1.4 per cent in a week to 21,964.27 points, the highest level year-to-date. Singapore’s Straits Times rose 0.7 per cent to 2,945.35 points. Japan’s Nikkei 225 index rose 0.8 per cent in a week to 16,627.25 points.
The US and European markets continued to rise amid a more cautious pace. The US Dow Jones Industrial Average increased only 0.3 per cent in a week to 18,570.85 points on Friday.
London’s FTSE100 added 0.9 per cent in a week to 6,730.48 points, the highest in 11 months, and Germany’s DAX Index rose 0.8 per cent to 10,147.46 points.
US dollar strengthened. The US dollar index futures rose from 96.6 points to 97.5 points last Friday. Gold continued to fall on stronger US dollar.
COMEX Gold declined 1.2 per cent in week to US$1,322.10 ounce. Crude oil (Brent) fell four per cent in a week to US$45.69 per barrel. Crude palm oil in Bursa Malaysia increased 1.7 per cent in a week to RM2,317 per metric tonne on stronger demand.
The FBM KLCI is still in a bullish trend despite the decline last week. The trend was supported to be bullish but was shocked by news and events surrounding 1MDB. The index is still above the short term 20-day moving average.
However, the FBM KLCI fell below the long term 200-day moving average it broke two weeks ago and is also in the Ichimoku Cloud indicator. Resistance remained at 1,670 points.
Momentum indicators declined but still bullish. The RSI and Momentum oscillator declined but above their mid-levels.
The MACD indicator remained above its moving average and the FBM KLCI stays above the mid-band of the Bollinger Bands. Immediate support level is at 1,645 points based on the short term 30-day moving average.
The weaker bullish momentum in global markets and the 1MDB news may cause market to continue to be cautious this week. We are expecting to see lower volume and the FBM KLCI to trade sideways.
Nevertheless, I am still expecting the market to be bullish as long as the FBM KLCI can stay above the immediate support level at 1,645 points. A breakout above 1,670 points again could bring the FBM KLCI to the 1,720 points resistance level.
The above commentary is solely used for educational purposes and is the contributor’s point of view using technical analysis. The commentary should not be construed as an investment advice or any form of recommendation. Should you need investment advice, please consult a licensed investment advisor.