Daily FBM KLCI chart as at August 7, 2015 using Next VIEW Advisor Professional
I have mentioned in my previous articles that the market is expected to be directionless if the FBM KLCI stayed between the support and resistance levels at 1,680 and 1,740 points.
Last week, the index tested both these levels and closed slightly above the support level.
The Malaysian ringgit, which fell to its lowest level against the US dollar in 17 years, and falling commodities prices especially crude oil weighed down the market. FBM KLCI fell 2.3 per cent in a week to 1,682.65 points last Friday after trading in a range between 1,677.22 and 1,744.19 points.
The market was being cautious last week and support was weak. The average trading volume last week declined to 1.5 billion shares from 1.8 billion shares the week before.
The average trading value in the past one week declined to RM1.6 billion as compared to RM1.9 billion.
There were some buying from foreign institutions in the first few days of last week but the selling starts in the latter part of the week, causing them to be the net sellers in Bursa Malaysia once again.
From Monday to Thursday last week, net selling from foreign institutions was RM209.2 million and net buying from local institutions was RM212.1 million.
Decliners trounced gainers five to one. Top gainers in the FBM KLCI were MISC Bhd (+5.1 per cent from last week), Westports Holdings Bhd (2.5 per cent) and Petronas Dagangan Bhd (one per cent). Top three decliners in the index were Tenaga Nasional Bhd (6.6 per cent), Kuala Axiata Group Bhd (5.8 per cent) and Digi.com Bhd (5.7 per cent).
Asian markets performances were mixed. China’s Shanghai Stock Exchange Composite Index, which fell 10 per cent two weeks ago, rebounded and rose 2.2 per cent in a week to 3,744.41 points. Hong Kong’s Hang Seng Index
declined only 0.3 per cent in a week to 24,552.47 points. Singapore’s Straits Times declined 0.2 per cent to 3,196.66 points last Thursday. Japan Nikkei 225 index increased 0.7 per cent in a week to 20,724.56 points.
The US market fell on anticipation of an interest rate hike but European markets were hopeful. On Thursday, the US Dow Jones Industrial Average declined 1.8 per cent in a week to 17,419.75 points.
However, Germany’s DAX Index increased 2.9 per cent to 11,585.10 points and London’s FTSE100 rose one per cent to 6,746.18 points.
The US dollar was firm against major currencies from last week and prices of major commodities remained bearish. The US Dollar index increased to 97.9 points from 97.4 points a week ago.
COMEX gold rebounded marginally and increased only 0.1 per cent in a week to US$1,088.90 an ounce. Crude oil price fell to its lowest in nearly four months.
WTI crude oil fell 7.4 per cent in a week to US$44.84 per barrel, the lowest in nearly five months. Crude palm oil in Bursa Malaysia declined 3.6 per cent in a week to RM2,042 per metric tonne.
Technically, the FBM KLCI trend is bearish below the short and long term 30 and 200-day moving averages. The index is also below the Ichimoku Cloud.
However, the index is currently on a crucial support level between 1,670 and 1,680 points. The index was supported twice at the level in the past two years and it is currently at this level.
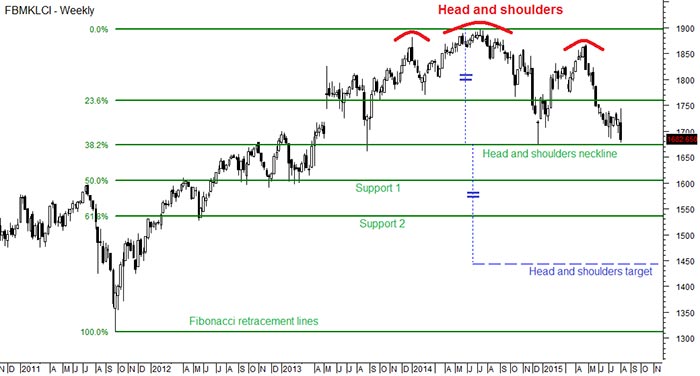
This support is also the confirmation of a long term bearish trend reversal ‘Head and Shoulders’ chart pattern.
In the short term the momentum of the index is strongly bearish as sentiment remains bearish. Most indicators, including the RSI, MACD and Bollinger Bands on the chart are indicating a strong bearish momentum.
The chart shown below is not the usual daily chart. It is a weekly chart to show you the longer term time frame of the FBM KLCI and the head and shoulders pattern.
At this juncture, the market is at a crucial support level. If there is a rebound, like it happened in the past two years, it shows that the market is still being supported but could only turn bullish if the index climbs above 1,740 points.
However, if there is no support then we will probably be looking at a bigger downward correction. The target for the head and shoulders pattern is at 1,440 points.
There are also support levels at 1,600, and 1,540 points. Therefore, let’s observe the performance of the market this week and with the current market sentiment, be prepared for bigger correction.
The above commentary is solely used for educational purposes and is the contributor’s point of view using technical analysis. The commentary should not be construed as an investment advice or any form of recommendation. Should you need investment advice, please consult a licensed investment advisor.