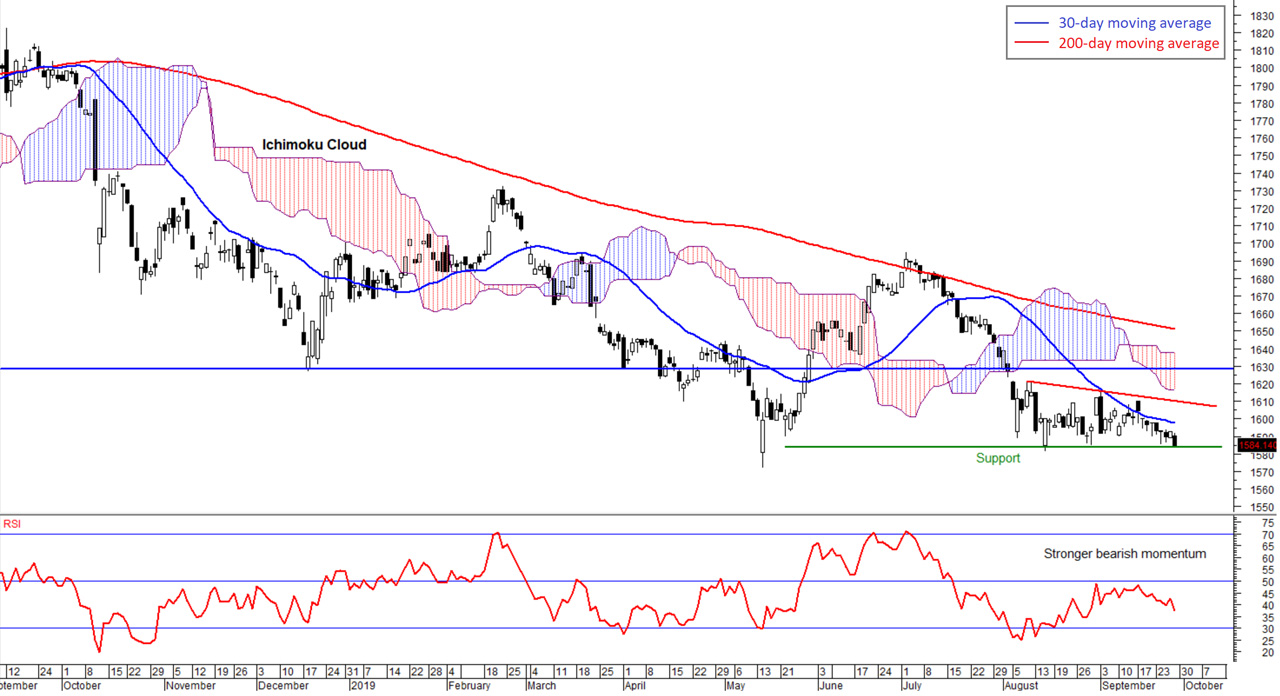
Daily FBM KLCI chart as at September 27, 2019
The market was bearish last week and the FBM KLCI fell to its lowest level in four years. The bearish performance was in line with bearish global markets performances. Falling commodities prices and weaker ringgit has contributed to the bearish market sentiment. The FBM KLCI declined 0.8 per cent in a week to 1,584.14 points last Friday.
Trading volume has declined last week as the market started to be cautious. The average daily trading volume in the past one week was at 2.1 billion shares as compared to 2.6 billion in the previous week. The average daily trading value fell to RM1.6 billion from RM2.2 billion. This indicates more lower-capped stocks were being traded.
In the FBM KLCI, decliners beat gainers 11 to three. The top three gainers were Westports Holdings Bhd (1.7 per cent in a week to RM4.17), Digi.com Bhd (1.5 per cent to RM4.74) and Axiata Group Bhd (1.2 per cent to RM4.33).
The top three decliners were Maxis Bhd (4.1 per cent to RM5.44), Top Glove Corporation Bhd (3.8 per cent to RM4.57) and AMMB Holdings Bhd (2.4 per cent to RM4.11).
Global markets performances were generally bearish last week except for the UK. The FTSE100 index closed higher. The bearish Asian market was led by China, which Shanghai Stock Composite Index fell 2.5 per cent.
The US dollar was stronger as compared to major currencies last week. The US dollar Index rose to 99.1 points last Friday from 98.5 points two weeks ago.
The Malaysian ringgit weakened against the US dollar at RM4.19 to a US dollar last Friday as compared to RM4.17 two weeks ago.
Major commodities fall last week. COMEX Gold futures declined 1.4 per cent in a week to US$1,503.30 an ounce last Friday.
Brent crude pulled back from a strong rally and declined 4.3 per cent to US$61.88 per barrel on Iran oil attack. In the local market, crude palm oil (BMD) declined 3.3 per cent to RM2,150 per metric ton last Friday.
The FBM KLCI fell slightly below the immediate support level of the sideways trend at 1,585 points last week.
This indicates that the bearish sentiment is gaining strength. The next support level is at 1,500 points. The immediate resistance level is at 1,500 points.
Trend-wise, the FBM KLCI is remained bearish below both the short and long term 30- and 200-day moving averages and the averages continue to decline. Furthermore, the index is below the Ichimoku Cloud indicator and the Cloud is expanding downwards.
Momentum indicators like the RSI and Momentum Oscillator continued tod decline after breaking below their mid-levels last week. This indicates that the bearish sentiment is gaining traction. Also, the MACD is starting to decline and is crossing below its moving average.
The market was consolidating in the past one month and the FBM KLCI traded between 1,585 and 1,610 points. We have mentioned last week that if the index breaks below 1,585 points, further downside is seen and the index may test the next support level at 1,545 points. This is where the market is probably heading if the index continues to stay below 1,600 points.
The above commentary is solely used for educational purposes and is the contributor’s point of view using technical al analysis. The commentary should not be construed as investment advice or any form of recommendation. Should you need investment advice, please consult a licensed investment advisor.

Global markets indices and commodities performances as at September 27, 2019